Interactive Flood Map
This page provides an interactive visualization of the flood areas around Monroe Lake based on current pool elevations.
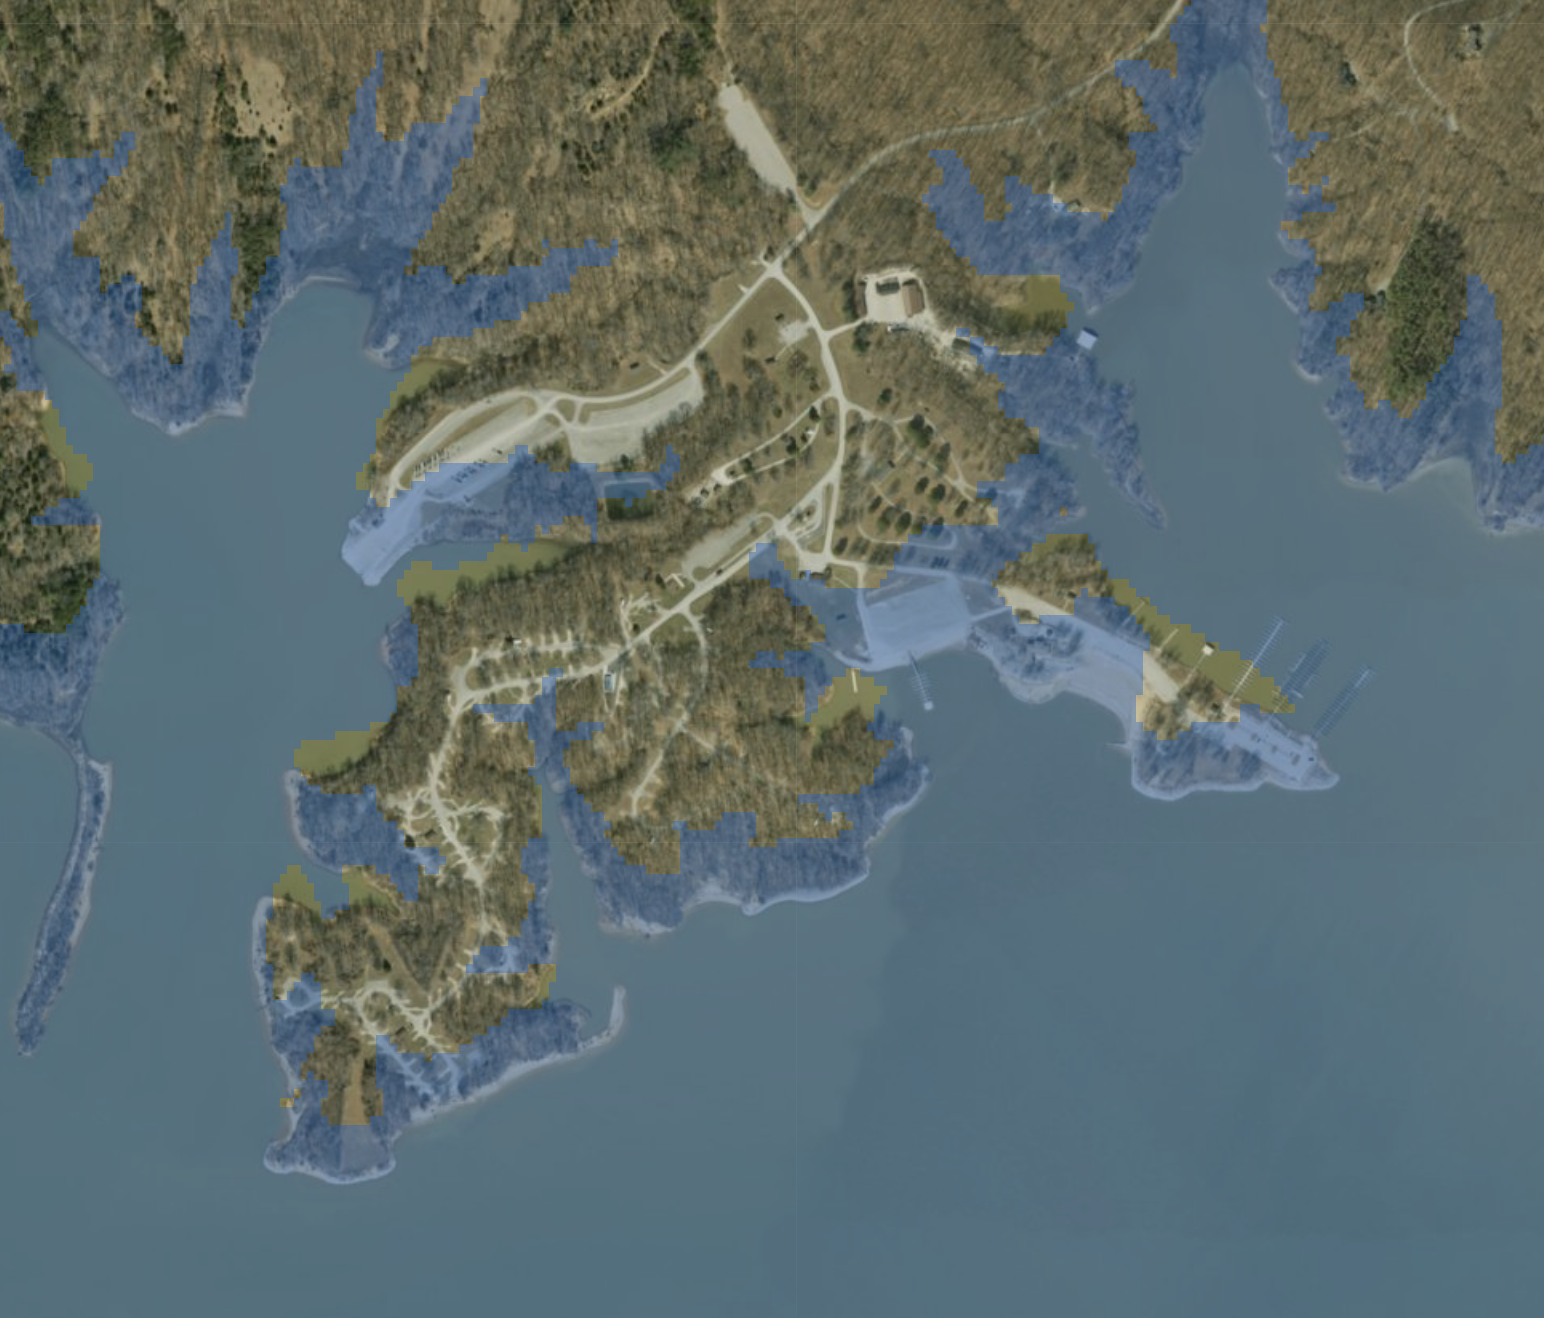
The map uses high-resolution USGS Digital Elevation Model (DEM) data to calculate which areas are submerged at a given water level.
Interactive Map
Click the button below to open the flood map in a new browser tab.
 Open Full-Screen Flood Map
How it Works
The flood map is generated by: 1. Downloading a 1/3 arc-second (~10m) DEM tile from the USGS 3DEP program. 2. Reprojecting the data to WGS84 (EPSG:4326) for precise alignment with satellite imagery. 3. Creating a binary mask where elevation is less than or equal to the current pool level. 4. Rendering the mask as a semi-transparent blue overlay on a Folium-based interactive map.
You can toggle between the Satellite View and OpenStreetMap using the layer control in the top right corner of the map.